

Bitcoin’s long-term valuation signals are drawing renewed attention as the Rainbow Chart once again places BTC in one of its most historically significant buying zones. The Rainbow Chart, a model that maps Bitcoin’s price across logarithmic growth bands, is widely used by long-term investors to visualize where the asset sits within its broader cycle, from undervalued to overextended.
At the moment, that signal is leaning decisively toward the former. BTC is now positioned in the “Fire Sale” band, the deepest blue zone on the chart and the most undervalued level the model can produce. This zone has appeared only six times since 2011, and each time, it marked a period where patient accumulation was followed by meaningful upside over the next 12 to 36 months. For investors tracking long-term valuation signals, this reading points to a rare window where long-term value has historically been most visible, potentially setting the foundation for the next phase of Bitcoin’s price cycle.
What Is the Bitcoin Rainbow Chart?
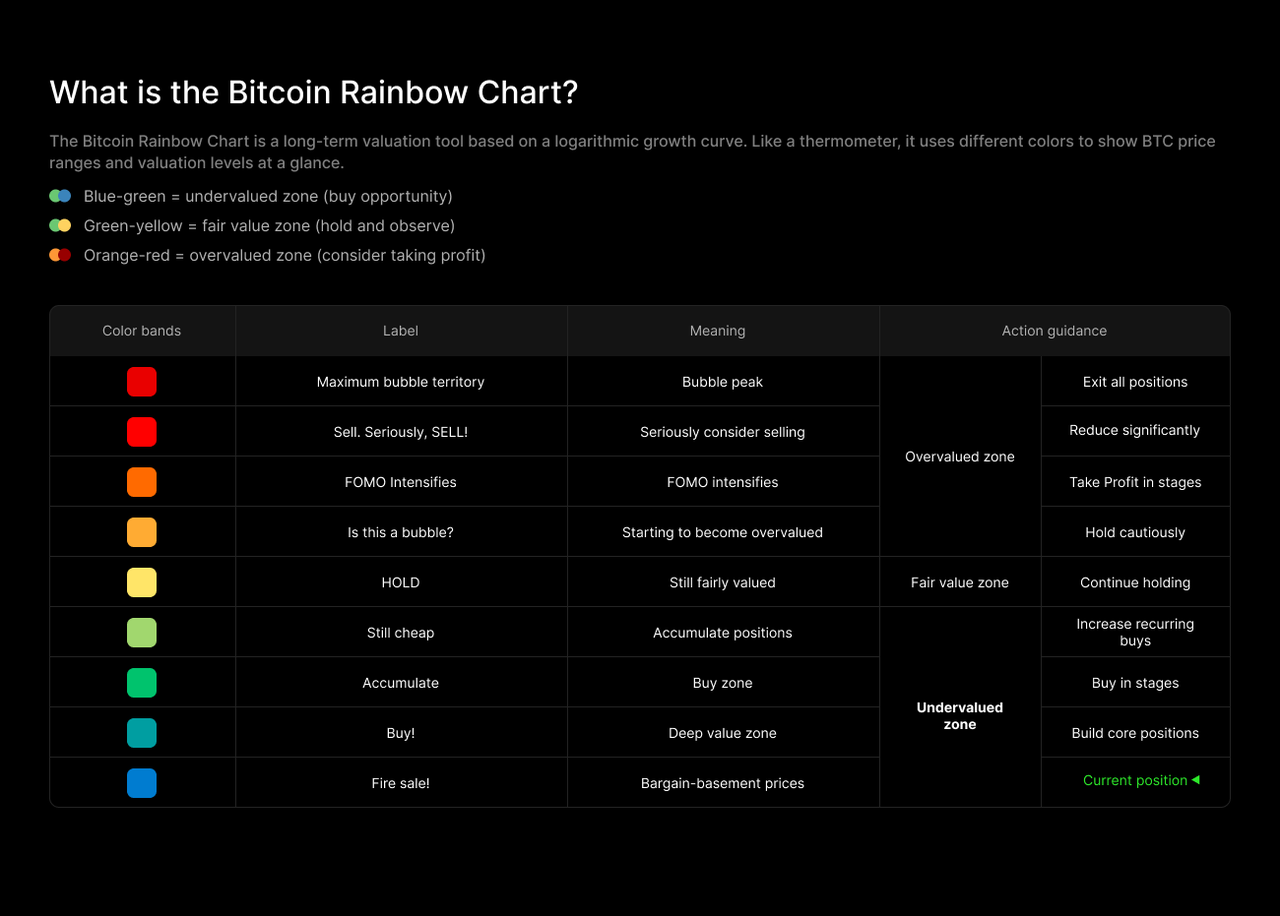
The Bitcoin Rainbow Chart is a long-term valuation tool built on a logarithmic regression model of Bitcoin’s price history since 2010. It divides that history into nine color-coded bands, each representing a different valuation range, from deeply undervalued at the blue end to overextended at the red end.
Because the model is anchored in Bitcoin’s long-term growth trajectory, the Rainbow Chart is designed to filter out day-to-day noise and instead reflect where Bitcoin stands relative to its historical price trend. Each band, in turn, maps to a distinct phase of the market cycle:
- Blue and teal bands (undervalued): Historically associated with accumulation phases and long-term entry opportunities.
- Green and yellow bands (fair value): Suggest Bitcoin is trading close to its historical growth trend.
- Orange and red bands (overvalued): Have typically aligned with late-cycle euphoria and prior market tops.
Taken together, the framework offers a clear way to interpret Bitcoin’s position within its long-term cycle, which is why the Rainbow Chart remains one of the most widely referenced tools for assessing long-term value.
Read More: What Is the Bitcoin Rainbow Chart and How to Use It in Crypto Trading?
Bitcoin Rainbow Chart Hits “Fire Sale” Band, Deepest Undervaluation Zone Seen Just 6 Times Before
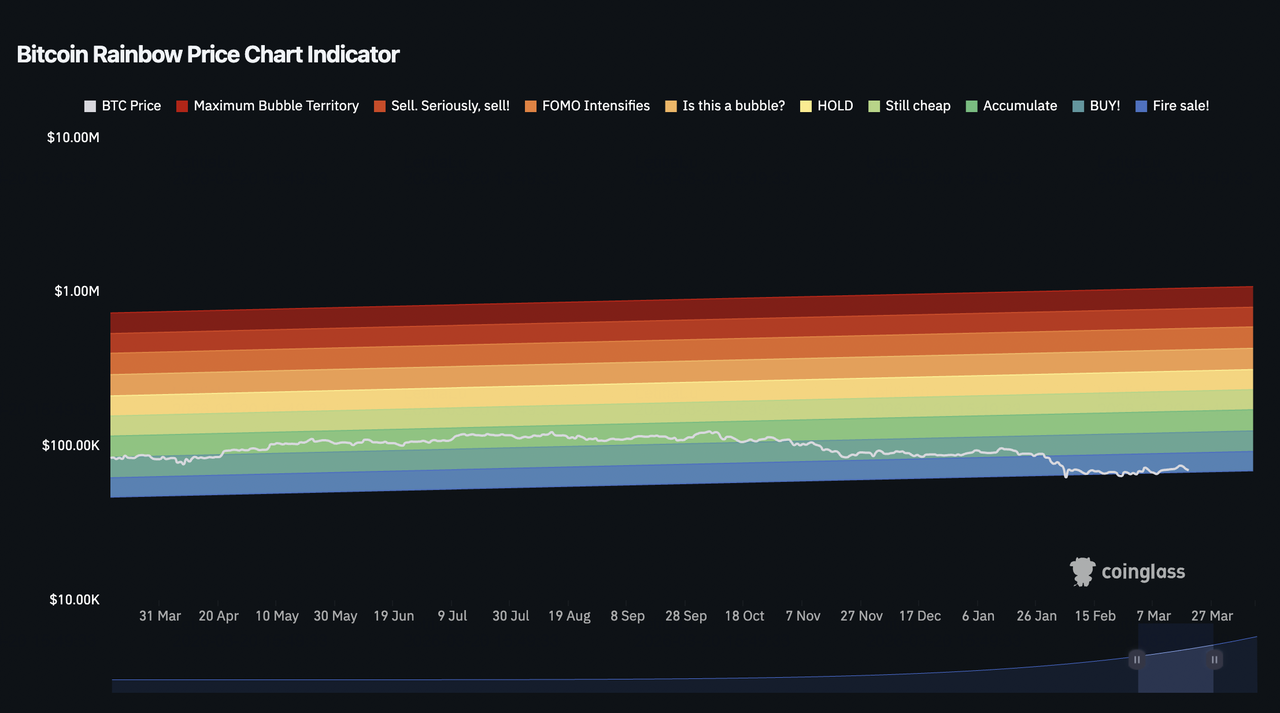
Image source: Coinglass
The Bitcoin Rainbow Chart currently places BTC in the “Fire Sale” band, the lowest and most undervalued zone identified by the model. This level has appeared only 6 times across Bitcoin’s full market history, making the current reading a relatively rare signal.
Each prior instance of the Fire Sale reading was followed by a significant long-term price recovery. Across these six occurrences, periods of accumulation at these levels consistently led to strong upside for long-term holders:
| Period | Duration | BTC Entry Price | BTC Peak Price | Return |
| Oct 2011 | 24 months | $2 | $1,200 | 30000% |
| Jan 2015 | 35 months | $177 | $20,000 | 11299% |
| Jan 2016 | 23 months | $430 | $20,000 | 4535% |
| Dec 2018 | 35 months | $3,200 | $69,000 | 2056% |
| Mar 2020 | 20 months | $4,800 | $69,000 | 1338% |
| Nov 2022 | 16 months | $16,000 | $73,000 | 356% |
Past performance does not represent future results.
Historically, reversals from the Fire Sale band have ranked among the strongest setups the Rainbow Chart has produced. While no indicator can guarantee future performance, the model’s track record across these six instances has made this band one of the most closely watched signals among long-term Bitcoin investors, often viewed as a rare window where long-term value becomes most visible.
What the Bitcoin Rainbow Chart’s Current Reading Means for Bitcoin
A Fire Sale reading represents the most extreme undervaluation signal the Rainbow Chart can produce. Historically, when Bitcoin enters this band, it has tended to mark the later stages of bear market cycles, often preceding multi-year recoveries as new cycles begin.
| Signal | What It Means |
| Fire Sale band reading | Deepest undervaluation zone; historically a long-term accumulation signal |
| Six prior historical appearances | Rare signal with a consistent track record of eventual recovery |
| Logarithmic model-based reading | Filters short-term noise; reflects long-term structural valuation |
- The Fire Sale Band Has Appeared Only Six Times in Bitcoin’s History: Each occurrence aligned with periods of deep market pessimism, typically near the end of a bear cycle. This rarity is what makes the signal notable, as prolonged downturns that push BTC into this zone have historically transitioned into accumulation and recovery phases.
- The Logarithmic Model Filters Out Short-Term Noise: Unlike indicators that react to daily price moves, the Rainbow Chart tracks Bitcoin’s long-term logarithmic growth trajectory. A Fire Sale reading is therefore not driven by short-term volatility, but reflects BTC’s position within its multi-year trend, making it a more stable signal for long-term investors.
- Prior Fire Sale Entries Rewarded Patient Capital: Across all six historical instances, investors who accumulated and held for 12 to 36 months recorded positive returns. While returns varied by cycle, the directional outcome, long-term recovery, was consistent across each occurrence.
How to Use the Bitcoin Rainbow Chart to Buy Bitcoin: Entry Timing and Allocation Strategy
The Bitcoin Rainbow Chart can be used to structure entries and allocate capital step by step, rather than trying to catch a single bottom. The key is to increase exposure as BTC moves deeper into undervalued zones.
| Phase | Entry Timing | Allocation Strategy |
| Initial Entry | BTC enters blue / light blue zones | Allocate 30–40% capital, open initial position |
| Accumulation | BTC remains in blue zone | Continue buying on weakness, increase DCA size |
| Aggressive Buying | BTC reaches deep blue (“Fire Sale”) zone | Deploy final 20–30% capital, lean into undervaluation |
In practice, start with a partial position once BTC enters the lower bands, then add systematically on dips rather than waiting for confirmation. If price moves deeper into the Fire Sale zone, treat it as a signal to increase conviction, not reduce exposure.
As BTC begins moving out of the lower bands, shift from active accumulation to holding. A sustained move into “Buy!” and “Accumulate” zones, especially alongside improving on-chain data and stronger spot demand, can signal that the accumulation phase is transitioning into recovery.
How to Buy or Trade Bitcoin on BingX
BingX gives users multiple ways to gain exposure to Bitcoin. Options include spot trading for direct BTC ownership and USDT-settled perpetual futures for leveraged long or short positions. Availability varies by region and regulatory requirements.
Buy Bitcoin (BTC) on BingX Spot
Users can buy Bitcoin on BingX Spot using USDT, enabling direct BTC ownership and continuous access to Bitcoin price movements within a crypto trading environment.
- Create and secure your BingX account: Register on BingX, complete identity verification (KYC) if required, and enable two-factor authentication (2FA) to protect your account.
- Deposit USDT or supported assets: Transfer USDT or other supported stablecoins into your BingX wallet. Select the correct blockchain network and review any minimum deposit requirements before proceeding.
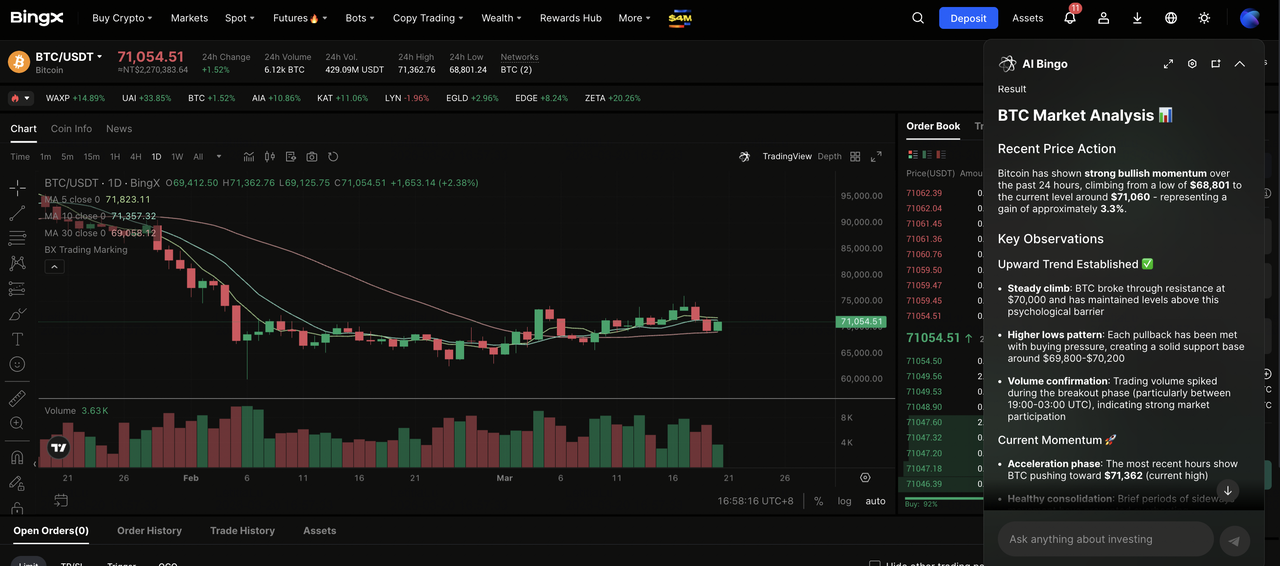
- Search for BTC/USDT in Spot Trading and assess market conditions: Go to the Spot market, search for BTC/USDT, and review the real-time price, order book depth, and recent trading activity. You can also ask BingX AI about recent price trends or key technical levels before placing your order.
- Place your buy order: Choose a market order for immediate execution or a limit order to set your desired entry price. Enter the purchase amount and confirm the trade.
Once completed, Bitcoin will appear in your BingX spot wallet. Spot Bitcoin carries market risk. Investors should size positions according to their risk tolerance and consider a staged entry approach when acting on longer-term valuation signals such as the Rainbow Chart.
Long or Short Bitcoin (BTC) Perpetual Futures with USDT on BingX
You can trade Bitcoin perpetual futures on BingX Futures using USDT to gain leveraged exposure or take both long and short positions. These USDT-settled contracts track Bitcoin's spot price and have no expiry date.
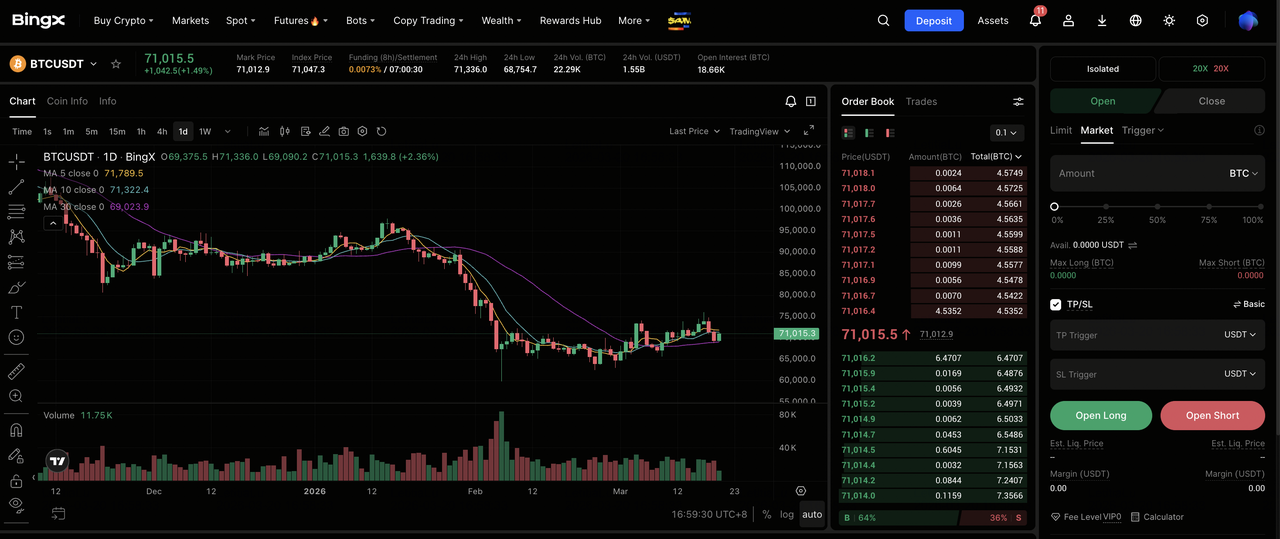
- Go to BingX Futures and find the BTC/USDT perpetual contract: Navigate to the Futures section and search for the BTC/USDT perpetual contract. Review the current price, funding rate, and open interest before proceeding.
- Select your margin mode and leverage: Choose between Isolated or Cross margin mode and set your leverage level. Bitcoin can move significantly during macro events and regulatory developments — careful position sizing is essential when using leverage.
- Choose your direction and place your order: Select Open Long if you expect the Rainbow Chart's undervaluation signal, improving U.S. demand, and institutional inflows to support a price recovery; or Open Short if you expect continued macro pressure, risk-off sentiment, or further consolidation to weigh on Bitcoin's near-term price.
- Set Take-Profit and Stop-Loss levels: Use Take-Profit/Stop-Loss orders to manage risk before market-moving events. Bitcoin can move sharply on macro headlines, ETF flow data, and on-chain signals — pre-set exit levels help protect positions in fast-moving conditions.
Leverage can amplify potential returns but also increases risk. Careful position sizing and risk management are essential when trading Bitcoin perpetual futures.
Final Thoughts
The Bitcoin Rainbow Chart’s current Fire Sale reading points to BTC trading at one of its deeper discounts relative to its long-term growth trajectory in recent years. With only six prior occurrences, this remains a rare signal, and historically, each instance has been followed by meaningful recovery over a 12 to 36 month horizon. While this does not guarantee an immediate rebound and BTC can remain undervalued for extended periods, it has consistently marked a rare window where long-term value has historically been most visible.
In that context, a staged accumulation approach remains the most practical strategy. Investors can scale in gradually across multiple entries rather than committing capital all at once, balancing timing risk while maintaining exposure to potential upside. As always, position sizing, time horizon, and overall portfolio context should guide decision-making.
Related Reading
- Coinbase BTC Premium Turns Positive: 3-Day Streak Signals Institutional Demand Rebound
- What Is the Bitcoin Rainbow Chart and How to Use It in Crypto Trading?
- What Is Crypto Fear and Greed Index and How to Use It in Crypto Trading?
- What Is Bitcoin Dominance (BTC.D) and How to Use It for Smarter Crypto Trading?
- How to Use the Relative Strength Index (RSI) in Crypto Trading