


An inverted hammer is a bullish reversal candlestick pattern that appears at the bottom of a downtrend. It has a small body at the lower end of the candle, a long upper shadow at least twice the body's length, and little to no lower shadow. The inverted hammer signals that buyers attempted to push prices higher during the session, suggesting that selling pressure may be weakening and a reversal could follow. It requires confirmation from the next candle before acting on the signal.
Can a single candle reveal when a massive market sell-off is about to hit a brick wall? While most traders fear a falling market, those who can identify an inverted hammer candlestick see a golden opportunity for a bullish reversal. This pattern serves as a high-stakes battleground where bearish momentum finally meets its match, signaling a potential shift in control from sellers to buyers.
In this guide, you will learn exactly how to identify the inverted hammer candlestick pattern, understand the market psychology behind it, distinguish it from the shooting star, and apply a step-by-step trading strategy with proper risk management on BingX.
From proper risk management to using momentum indicators for confirmation, we’ll provide the roadmap to trading the inverted hammer candlestick pattern with clinical precision.
What Is an Inverted Hammer Candlestick Chart Pattern?
The inverted hammer candlestick is a bullish reversal chart pattern that serves as a visual representation of a shift in market control. It typically appears after a downtrend, marking a point where the prolonged selling pressure is being challenged by emerging buyers.
At its core, the inverted hammer shows a tug-of-war: sellers tried to keep prices low, but buyers stepped in with enough strength to push the price significantly higher during the session. Even if the price settles back near the open, the long upper shadow acts as a footprint of bullish intent.
Key Features of the Inverted Hammer Pattern
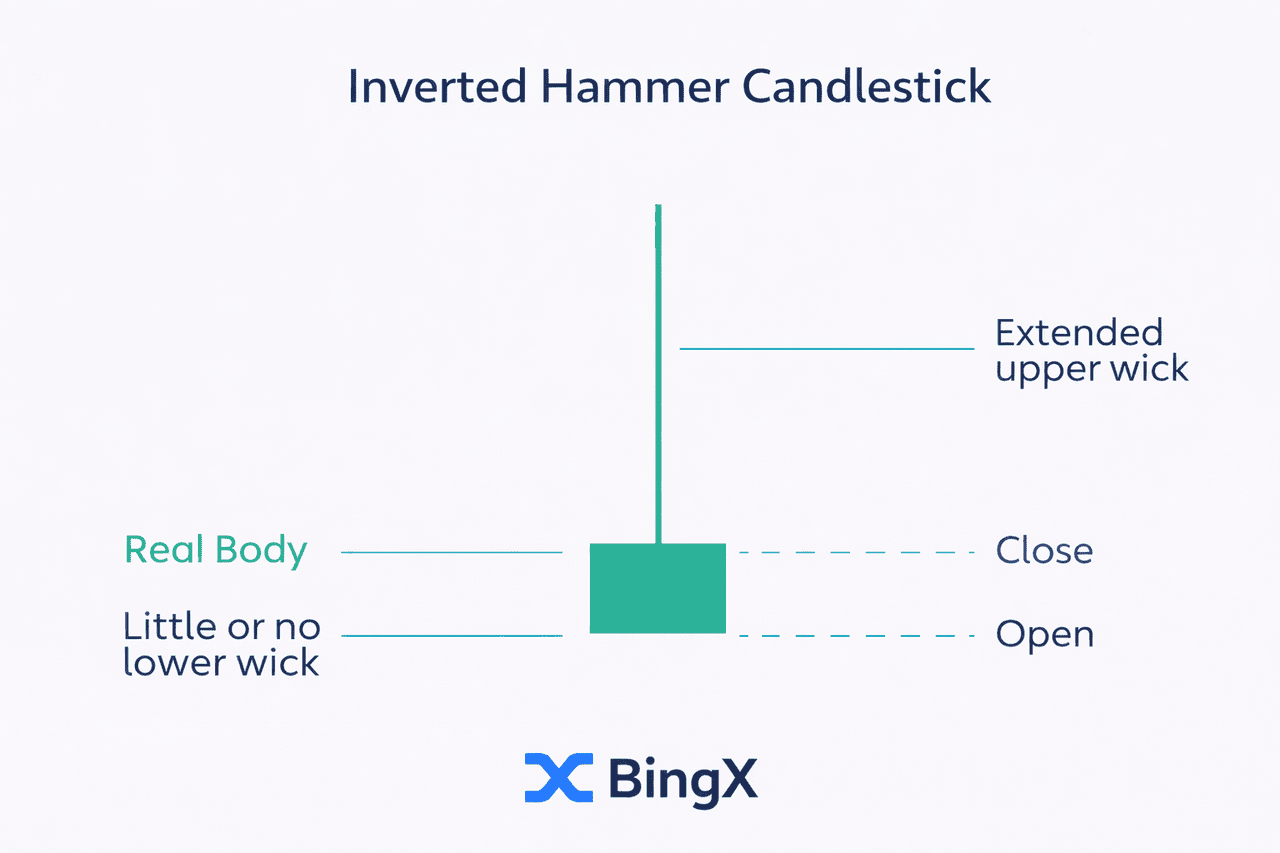
To identify an inverted hammer correctly, you must look for four specific physical characteristics:
- Small Body at the Bottom: The opening price and closing price are very close to each other, resulting in a small body located at the lower end of the session's range.
- Long Upper Wick / Long Upper Shadow: This is the most defining feature. The upper shadow should be at least two to three times the length of the candle's body.
- Little to No Lower Shadow: A true inverted hammer forms with a very short or non-existent lower shadow, indicating that the market did not trade significantly below its opening or closing price.
- Market Context: The pattern only carries a bullish signal when it occurs after a clear downtrend.
What Is the Psychology Behind the Long Upper Wick in an Inverted Hammer?
The long upper wick (or long upper shadow) is the most critical part of the story. It represents a bold attempt by bulls to push prices higher.
- Buyers Testing Higher Prices: For the first time in the bearish trend, buyers were strong enough to drive the price up significantly.
- Sellers Losing Control: Although sellers managed to push the price back down toward the open, they were unable to create a new low. This failure to continue the downtrend indicates that the bearish pressure is fading.
Why the Body at the Inverted Hammer's Bottom Matters
The small body at the bottom of the candle is equally important. It shows that despite the volatility and the massive spike in price during the session, the opening price and closing price remained near the session's lows. This compressed body at the bottom signifies a "standoff." The bears couldn't push the price lower, and the bulls couldn't hold the peak—but the refusal of the market to make a lower low is a bullish signal.
Why Does the Inverted Hammer Signal a Potential Bullish Reversal?
The inverted hammer signals a potential bullish reversal by showing bears are losing control. The long upper wick proves buyers finally found the bullish momentum to challenge prolonged selling pressure. Even without a high close, this "test" suggests bearish pressure is exhausted.
When this candlestick pattern appears after a clear downtrend, it marks a psychological shift where a trend reversal becomes imminent.
What the Inverted Hammer Reflects About Market Sentiment
The inverted hammer candlestick meaning goes far deeper than just its shape on a price chart; it is a visual map of a psychological shift in market sentiment. After a period of prolonged selling pressure, the market reaches a state of exhaustion.
When an inverted hammer forms, it tells the story of a dramatic intraday battle where the "bears" (sellers) finally met significant resistance.
In a clear downtrend, the sentiment is overwhelmingly negative. However, the inverted hammer shows the first real crack in that bearish armor. It reflects a moment where the bearish momentum is challenged by a sudden influx of buyers. Even if the price doesn't close at its daily high, the fact that it reached those levels at all suggests that the "bottom" may be near.
Potential Shift in Control: Bearish Pressure vs. Bullish Momentum
The inverted hammer reflects a transition phase:
- Phase 1: The market is dominated by bearish momentum and constant selling.
- Phase 2: The inverted hammer appears, showing bulls are finally "testing the waters."
- Phase 3: A potential shift in control occurs as the market prepares for a bullish reversal.
Understanding this candlestick pattern means recognizing that while the bears haven't left the building yet, the bulls have officially arrived to claim their territory.
Inverted Hammer vs. Shooting Star: Key Differences
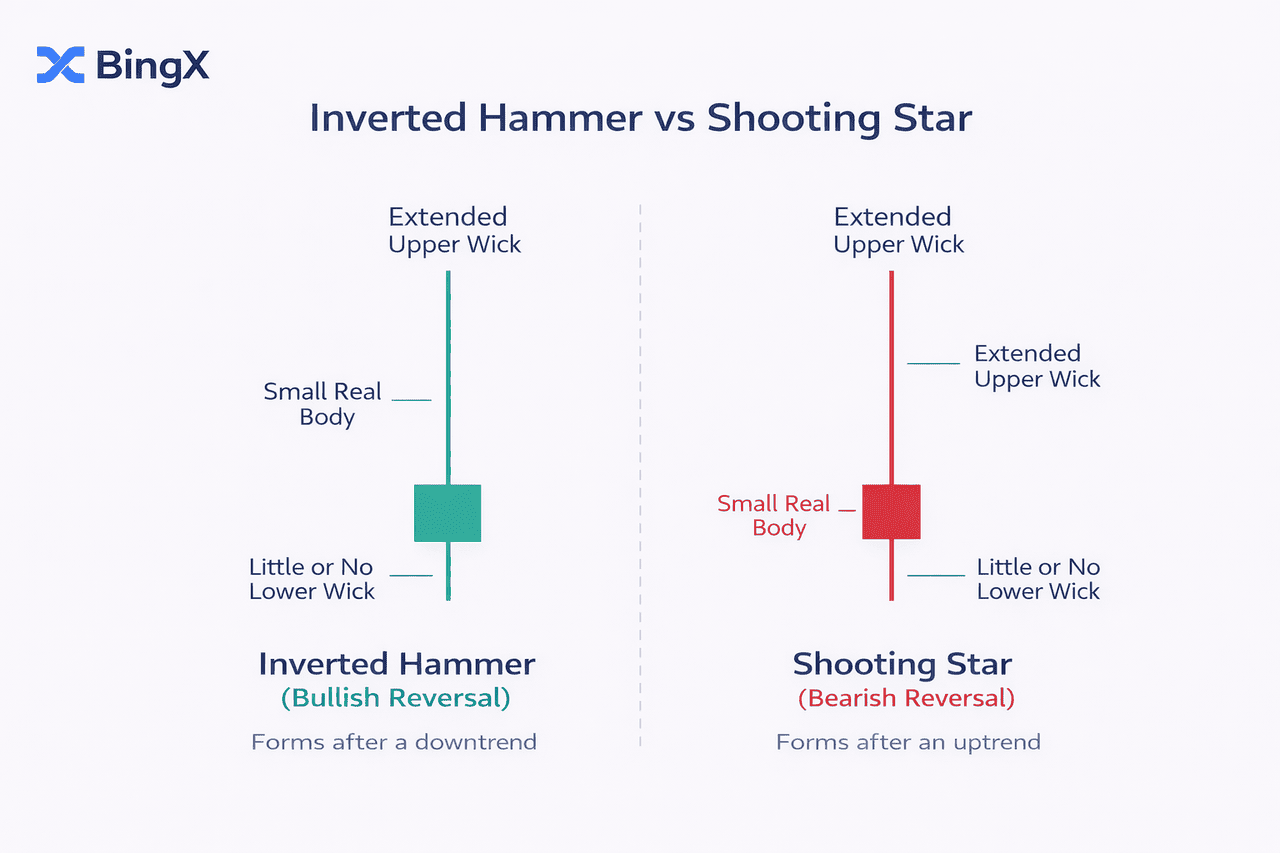
The inverted hammer and shooting star are visually identical, both show a small body at the bottom with a long upper shadow and little or no lower shadow. The difference that separates a bullish signal from a bearish one is entirely about where in the trend the candle appears.
|
Feature |
Inverted Hammer |
Shooting Star |
|
Visual Shape |
Small body, long upper wick |
Small body, long upper wick |
|
Prior Trend |
Bearish trend (Downtrend) |
Bullish trend (Uptrend) |
|
Signal Type |
Bullish reversal signal |
Bearish signal |
|
Market Sentiment |
Sellers are losing control |
Buyers are losing control |
One of the most common points of confusion for new traders is the distinction between the inverted hammer and the shooting star. Visually, they have the same shape: a small body at the bottom with a long upper shadow and little to no lower shadow.
However, in technical analysis, the shape is only half the story. The broader market context, specifically where the candle appears on the price chart, determines whether the signal is a bullish reversal or a bearish reversal.
Different Market Context, Different Meaning
The primary difference lies in the preceding trend. Without identifying the trend, you cannot identify an inverted hammer correctly.
- The Inverted Hammer: This pattern appears after a clear downtrend or a period of prolonged selling pressure. In this context, it acts as a possible bullish reversal signal, suggesting the bottom is in.
- The Shooting Star: This candle appears at the peak of an uptrend. In this context, the same shape indicates that buyers are exhausted and the price has hit a ceiling, signaling a bearish reversal.
By understanding this distinction, you can avoid the "trap" of entering a trade based on shape alone. Always zoom out to see the market context before placing an order.
Read more: How to Trade the Shooting Star Candlestick Pattern in Crypto: Spotting Bearish Reversals
How to Trade the Inverted Hammer Pattern: Step-by-Step Strategy
Trading the inverted hammer pattern requires a systematic approach to avoid false signals. Using the Bitcoin (BTC/USDT) example, we can see how the inverted hammer signal develops into a high-probability trade when combined with market context.
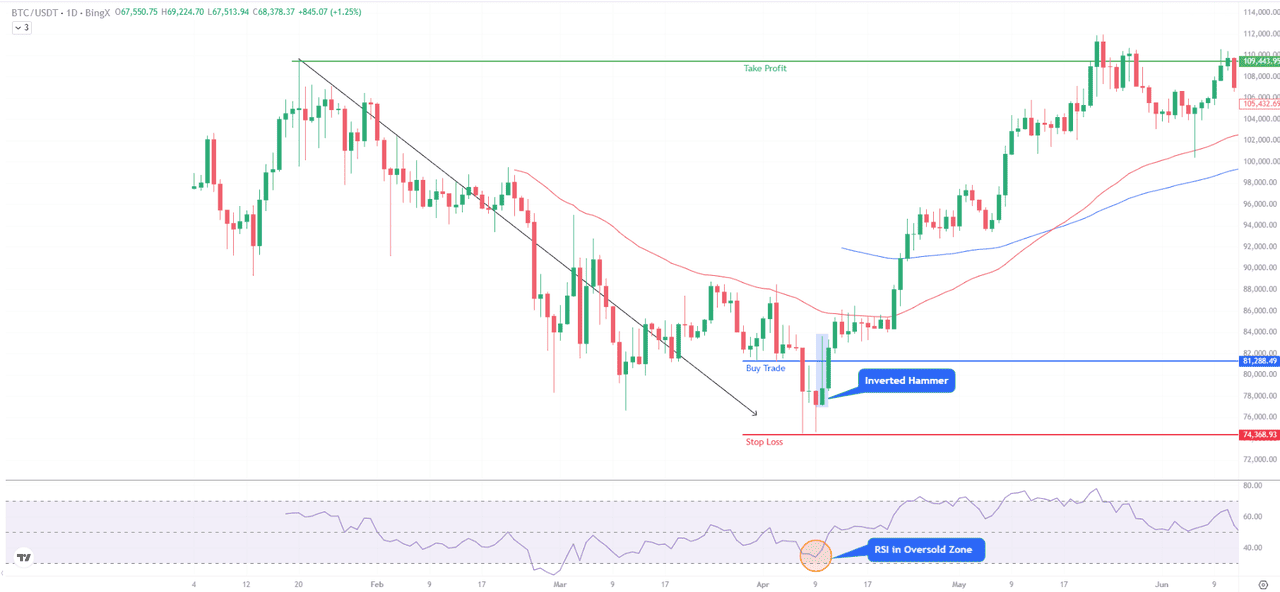
Bitcoin (BTC/USDT) Price Chart - Source: BingX
1. The Entry Strategy: Patience for Confirmation
Never enter a trade the moment an inverted hammer forms. To identify an inverted hammer correctly as a tradeable event, you must wait for confirmation.
- The Trigger: Place a buy order just above the inverted hammer's high. In the example, the entry is set at the $81,300 level.
- The Confirmation: The next candle must be a strong bullish candle closing above the entry line.
2. Stop Loss Placement: Protecting Your Capital
Proper risk management protects your capital from bearish momentum restarts.
- Stop Loss: Place it slightly below the lower shadow of the hammer. In the screenshot, this is marked at $74,370.
- Take Profit: Target previous resistance zones. The target in this setup is the swing high at $109,450, offering a risk-to-reward minimum of 1:2.
3. Technical Synergy
In the example, the inverted hammer appears while the Relative Strength Index (RSI) is in the Oversold Zone (marked by the orange circle). This confluence of a candlestick pattern and momentum indicators creates a much stronger signal.
What Does a Green vs. Red Inverted Hammer Mean?
The colour of the inverted hammer body adds an extra layer of context:
- Green inverted hammer (close > open): The session closed higher than it opened. This is a slightly stronger signal because buyers maintained some control by the end of the candle.
- Red inverted hammer (close < open): The session closed lower than it opened. The signal is still valid but requires stronger confirmation from the next candle.
In both cases, the defining feature is the long upper shadow, not the body colour. Never skip confirmation based on colour alone.
How to Trade the Inverted Hammer on BingX
Once you have identified a confirmed inverted hammer on BingX charts, here is how to execute the trade:
1. Open the BingX trading chart and switch to a daily or 4-hour timeframe for the most reliable signals.
2. Identify the downtrend: Confirm at least 3–5 consecutive bearish candles or a clear declining structure.
3. Spot the inverted hammer: Small body at the bottom, long upper wick (2x+ body length), minimal lower shadow.
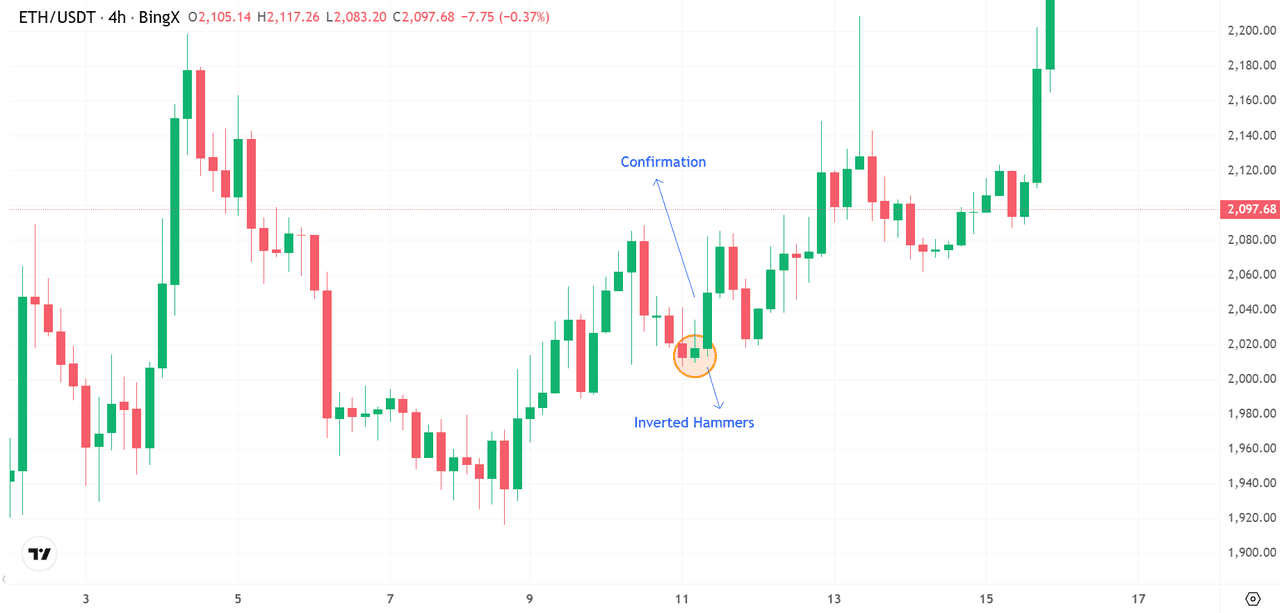
Ethereum (ETH/USDT) Price Chart - Source: BingX
4. Wait for confirmation: The next candle must close above the inverted hammer's high.
5. Enter the trade: Place a buy order just above the confirmation candle's high.
6. Set your stop loss: Below the inverted hammer's lowest point.
7. Set your take profit: Target the next resistance zone or use a minimum 1:2 risk-to-reward ratio.
Inverted Hammer vs. Regular Hammer: What's the Difference?
New traders often confuse the inverted hammer with the regular hammer candlestick, they are related patterns but look opposite on a chart.
|
Feature |
Inverted Hammer |
Regular Hammer |
|
Body position |
Small body at the bottom |
Small body at the top |
|
Long shadow direction |
Long upper shadow |
Long lower shadow |
|
Where it appears |
Bottom of a downtrend |
Bottom of a downtrend |
|
Signal type |
Bullish reversal |
Bullish reversal |
|
Which is stronger? |
Needs more confirmation |
Slightly more reliable |
Both inverted and regular hammer patterns appear at the bottom of downtrends and signal the same thing, a potential bullish reversal. The regular hammer is considered slightly more reliable because the long lower wick directly shows buyers rejecting lower prices in real time. The inverted hammer's long upper wick is more of a "test", buyers reached for higher prices but didn't hold them, which is why confirmation is critical.
Read more: Using the Hammer Candlestick Pattern to Identify Crypto Trend Reversals
How to Use Technical Indicators With the Inverted Hammer
While the inverted hammer candlestick is a powerful visual cue, relying on a single candle is risky. To improve reliability and filter out false signals, professional traders look for confluence with other technical indicators.
Key Technical Pairings
- RSI Bullish Divergence: If the price chart shows lower lows but the RSI shows higher lows, a bullish divergence exists. When an inverted hammer forms during this divergence, the reversal signal is significantly stronger.
- Support and Resistance Zones: An inverted hammer appears with much higher validity when it touches a key support level or a psychological round number. This suggests the market has found a "floor."
- Volume Confirmation: Look for a spike in trading volume during the inverted hammer formation or on the next candle. High volume indicates that "smart money" is participating in the potential shift in control.
- MACD Crossover: A bullish crossover on the MACD (moving average convergence divergence) shortly after the pattern appears validates that bullish momentum is building.
- Fibonacci Retracement: If the hammer aligns with a 61.8% or 50% Fibonacci level, it acts as a technical anchor for a possible trend reversal.
The Takeaway: No pattern is an island. Always combine the inverted hammer signal with momentum indicators and market context to increase your win rate and ensure proper risk management.
When Does the Inverted Hammer Pattern Fail?
Even a perfect upside down hammer can result in a loss. Recognizing failure is vital for proper risk management.
- Sideways Markets: Without a clear downtrend, the inverted hammer candlestick pattern lacks the bearish pressure necessary to trigger a reversal.
- Weak Confirmation: If the next candle fails to close above the hammer’s high, the bullish momentum has likely stalled.
- The Invalidation Point: If the price breaks below the inverted hammer’s low, the potential bullish reversal is dead. This often reinforces a bearish signal, suggesting sellers have regained control.
How to Avoid False Signals
The single most effective filter is waiting for confirmation. Traders who enter the moment an inverted hammer forms, without waiting for the next candle, experience significantly higher failure rates. The pattern is a warning sign, not a trade trigger on its own.
A secondary filter is volume. An inverted hammer forming on below-average volume is far more likely to fail than one that forms on a volume spike. Low volume means institutional participants are not behind the move.
Conclusion: How to Trade Crypto with the Inverted Hammer
The inverted hammer is a powerful ally for any trader, but its effectiveness lies in discipline. While it signals a possible bullish reversal, remember that market context matters far more than the shape of a single candle. To trade with confidence, always wait for confirmation, a strong bullish candle closing above the hammer's high is your green light.
Maximize your success by combining this candlestick pattern with technical analysis tools like support levels and momentum indicators. Above all, apply proper risk management to protect your capital.
The Takeaway: The inverted hammer is not a magic signal, it’s an early warning of a potential trend reversal that requires a patient, data-driven approach.
Related Reading
- 10 Key Indicators to Signal a Crypto Bull Run
- Mastering Candlestick Charts in Cryptocurrency Trading: A Complete Guide
- How to Use Moving Average Convergence Divergence (MACD) in Crypto Trading
- How to Use the Relative Strength Index (RSI) in Crypto Trading
- How to Use Pin Bar Candlestick Strategy to Trade Reversals in Crypto
- Using the Hammer Candlestick Pattern for Identifying Cryptocurrency Trend Reversals
- How to Use the Evening Star Pattern to Predict Market Trends in Crypto Trading
- What Are Crypto Chart Patterns? Head & Shoulders, Triangles, Wedges Explained
- Mastering Candlestick Charts in Cryptocurrency Trading
FAQs: Inverted Hammer Candlestick Pattern
1. Is the inverted hammer bullish or bearish?
The inverted hammer is a bullish reversal signal. It appears at the bottom of a downtrend and suggests that selling pressure is weakening and buyers may be gaining control. However, it must be confirmed by the next candle closing higher before it is considered a valid trade signal.
2. What is the success rate of the inverted hammer?
The inverted hammer has an estimated success rate of approximately 60–65% when confirmation is required before entry. Its reliability increases significantly when it forms at a key support level, when the RSI is oversold, or when it appears on higher timeframes such as daily or weekly charts.
3. What does a green inverted hammer mean?
A green inverted hammer forms when the closing price is higher than the opening price. It is considered a slightly stronger bullish signal than a red inverted hammer because buyers maintained some control within the session. However, the shape, specifically the long upper wick, matters more than the colour.
4. What confirms an inverted hammer?
Confirmation occurs when the candle immediately following the inverted hammer closes strongly above the inverted hammer's high. A strong bullish candle with good volume is the most reliable confirmation. Additional confirmation comes from RSI oversold readings, MACD bullish crossovers, and proximity to key support levels.
5. Can an inverted hammer appear in an uptrend?
Yes. When the same visual shape, small body at the bottom with a long upper wick, appears at the top of an uptrend, it is called a shooting star, not an inverted hammer. The shooting star is a bearish reversal signal. This is why identifying the preceding trend is essential before labelling any pattern.
6. How is the inverted hammer different from the regular hammer?
Both appear at the bottom of downtrends and signal bullish reversals. The key visual difference is shadow direction: the inverted hammer has a long upper shadow (buyers tested higher prices), while the regular hammer has a long lower shadow (buyers directly rejected lower prices). The regular hammer is considered slightly more reliable.
7. What timeframe is best for the inverted hammer?
The daily and 4-hour timeframes produce the most reliable inverted hammer signals in crypto trading. On lower timeframes (15-minute or 1-hour), the pattern appears more frequently but generates more false signals due to market noise.
8. Should I use the inverted hammer alone?
No. The inverted hammer is a warning signal, not a standalone trade trigger. It should always be used in combination with at least one or two confirming factors, such as RSI oversold, a key support level, or a volume spike, to reduce false signals and improve trade accuracy.